
Spend and limits
Two places: the dashboard on the home screen and a screen of its own.
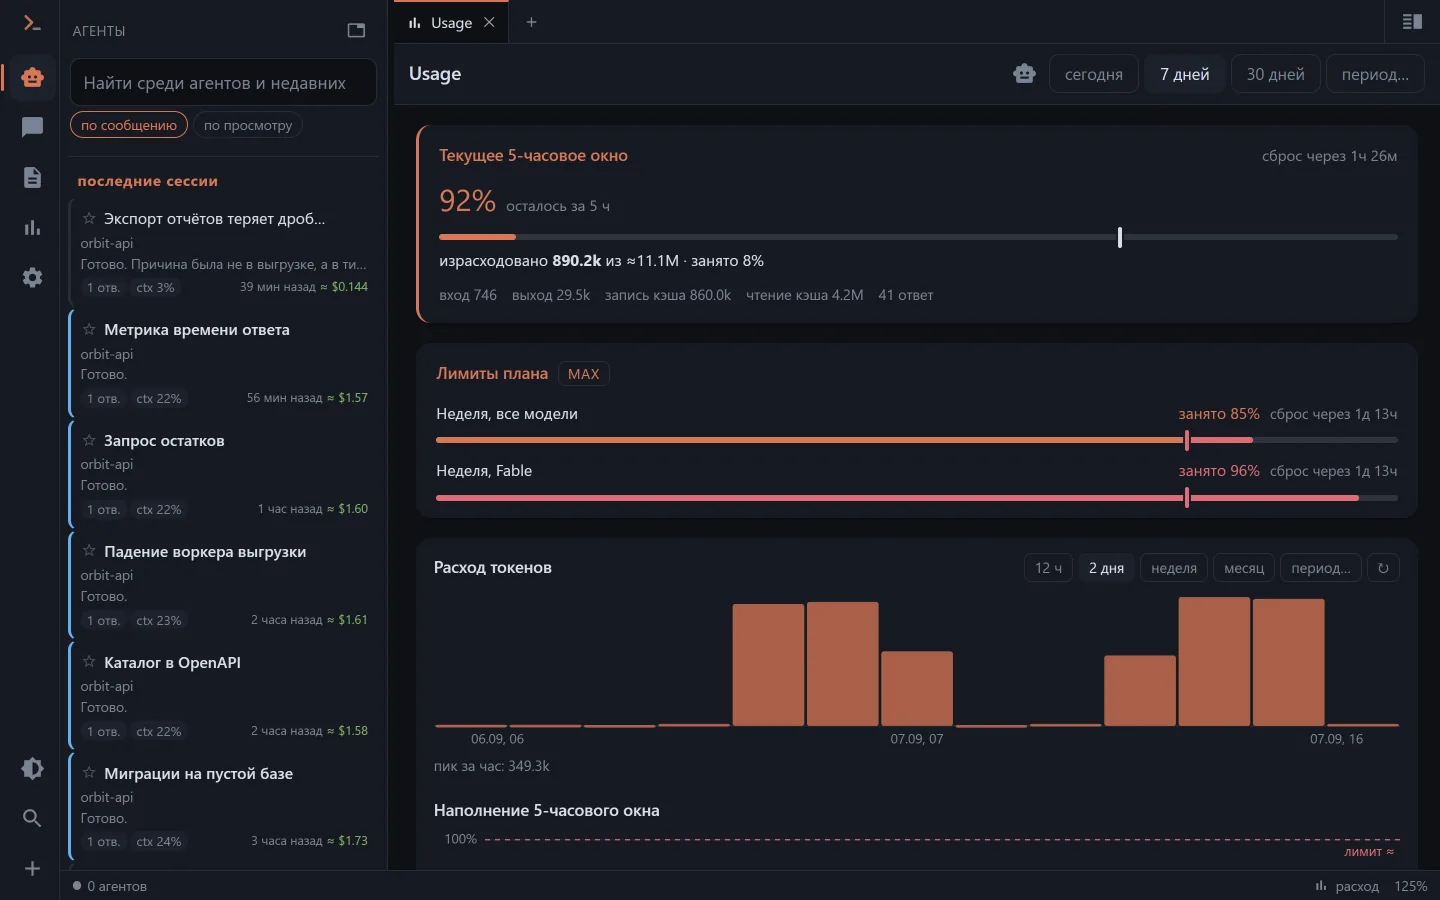
The dashboard on the home screen
Hourly spend bars and the fill of the 5-hour window. That is usually enough to tell whether to start a big task now or wait.
The spend screen
- plan limits — the 5-hour window and the weekly ones (overall, per model, per third-party app);
- breakdowns by day, model and project;
- a network traffic chart for the api itself, split by client.
The pace mark on the limit bars shows how much of the window's time has already passed. Spend to the left of the mark — you will fit; to the right — you are burning faster than the clock runs. That is more useful than a bare percentage: 60% in the first hour of a five-hour window and 60% in the fourth are different news.
A share of the window instead of a sum
On a subscription dollars take nothing off, and "≈ $2.40 for this chat" doesn't answer the only real question: whether to start the next task here. So the common badge row carries a ≈ 12% chip — the share of the five-hour window already eaten. It is on the chat, on the agent and in the app panel's rows; the API-price estimate and the tokens haven't gone anywhere — they are in the chip's tooltip and in the spend list's line.
A project gets the same measure summed across all its chats, and it deliberately has no 100% ceiling: a project accumulates over years and really does eat dozens of windows, so ≈ 2100% is not an error. If the plan's limit is unknown, the chip falls back to the old sum in dollars.
A spending cap
You set a task from the phone and walked away — it helps to know the agent won't eat too much in a day. The "Agent" tab of the settings has two thresholds in dollars for the last day (a sliding 24 hours, not a calendar day), both optional:
- a warning — a plate with the sum appears above the new-chat field;
- a stop — the server won't start a new chat, including from the Telegram bot. Running chats keep going and can be continued: cutting work off mid-reply over a sum is worse than paying for its tail.
The sum is counted from the same transcripts at API prices. On a subscription it is an estimate, on an API key it is the real bill; your own model servers cost nothing. Only the owner sets the thresholds. A key scoped to projects doesn't see the sum: it is the whole machine's money, not its projects'.
In the chat
The token line under the composer shows the spend rate when tapped. Under a message about a limit you have hit there is a countdown to the reset — 5 hours, a week, and the weekly windows per model.
Right next to it is the context window, but that is about something else: context is how much fits into one conversation, a limit is how much you have left on the plan.
Where the numbers come from
From the same transcripts: the api parses the records and keeps an index in SQLite (clauder.db) next to the sessions directory.
That gives two quirks worth knowing about:
- The first visit after a long break may lag behind. The index catches up by scanning and runs into a budget; a repeated request picks up the rest.
- A broken index is cured by deleting the file.
clauder.dbcan be deleted — it will be rebuilt. Favourites, your own titles and "read" marks go with it, though: they live in the same place.
The limit warning
A separate toggle in notifications sends a warning at 95% — both for the 5-hour window and for the weekly ones. It is about the whole machine, not only about your chats in Clauder.